

Calibrate SenseAi and SenseAi Embedded
Tune running and stopped detection for one specific machine.
A SenseAi arrives with settings taken from machines like yours, which is a starting point rather than an answer. Two machines of the same model and age vibrate differently, and so does one machine depending on where the device sits. Calibration is how you check that this device tells running apart from stopped here, and correct it when it does not.
Expect 15 to 30 minutes for a first calibration, most of it spent watching the machine work.
Prerequisites. The device must be online, see Connect a device to Wi-Fi. You need to be able to run the machine and stop it while you watch.
What calibration decides
A SenseAi reports one of two states: running or down. There is no third state and nothing in between. The state flips when the vibration trace crosses a threshold and stays across it long enough.
Everything downstream comes off that one decision. Uptime, downtime, and the part counts and cycle times derived from the same trace are all built on where you put the thresholds. See Metrics reference.
Calibrate after installing a device, after moving one, after significant machine maintenance, and whenever the numbers stop matching what the floor says happened. You do not need to recalibrate after a part change unless the new part changes the machine's idle vibration.
This is also how you find out whether the device is mounted somewhere useful. A device on the machine housing can read the machine perfectly well. What settles it is running the machine cutting and then idle and checking that the two read differently, rather than judging the mount by eye.
Open the calibration view
- Open the machine from Assets.
- Click the picture of the device beside the machine name.
- Stay on the Calibration tab, which opens by default.
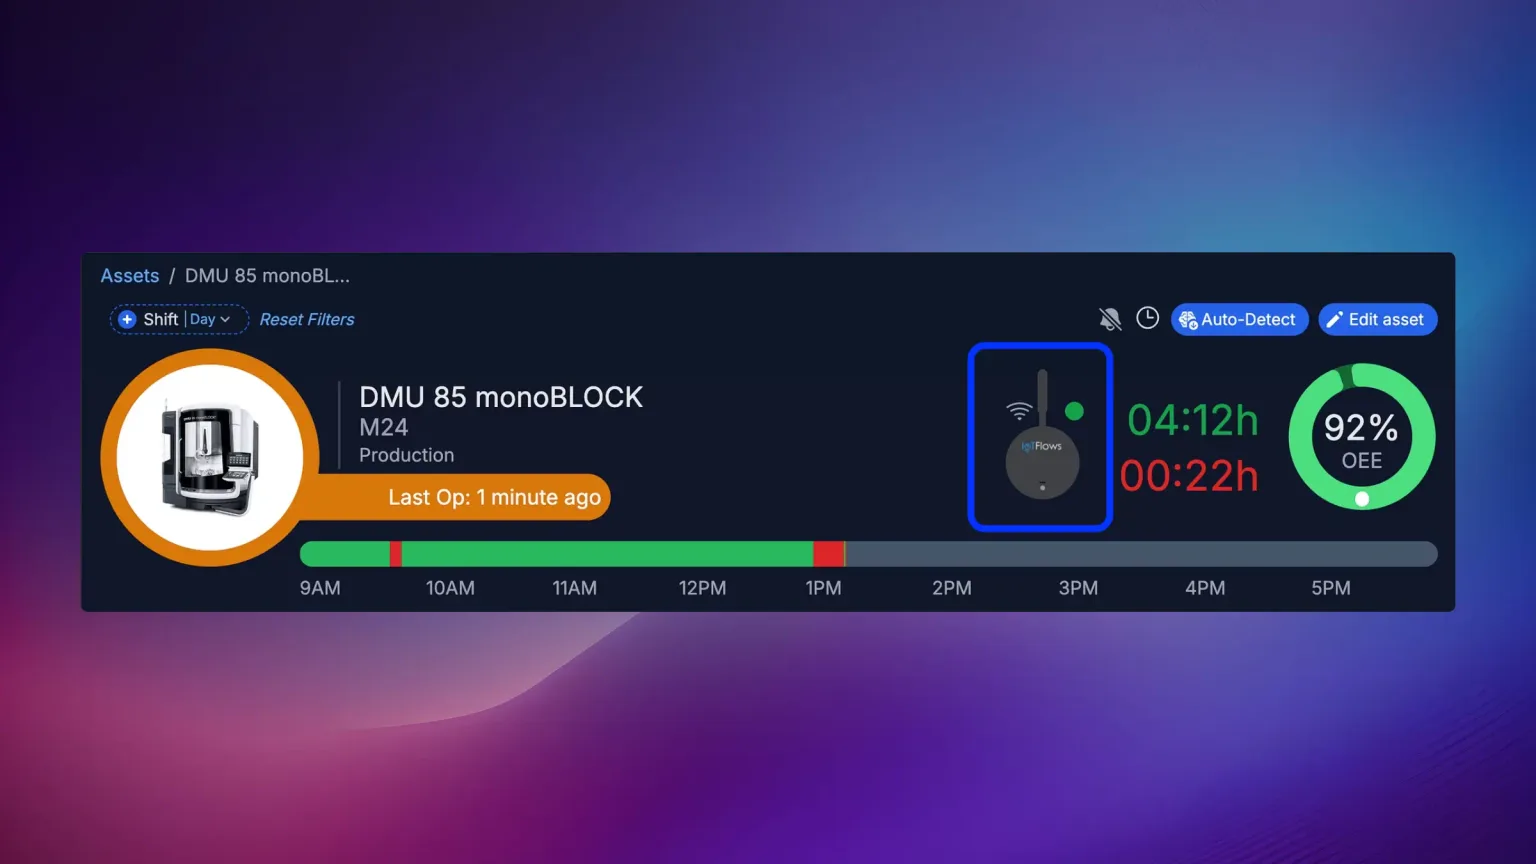 Click the device image on the machine's page to open its calibration view.
You can also reach the same view from Devices, which suits working through several sensors in one sitting. Getting to a device there takes the Edit Sensor button rather than a click on the sensor card, see Open a device.
The header above the tabs names the device, its firmware version, its IP and MAC addresses, the network it is on, and the machine it reports for. Check the firmware version now. The live capture panel described below needs 2.0 or later. Below that, the tab shows three sliders with their own submit buttons and none of the charts, and the only controls are sensitivity, momentum and shock threshold.
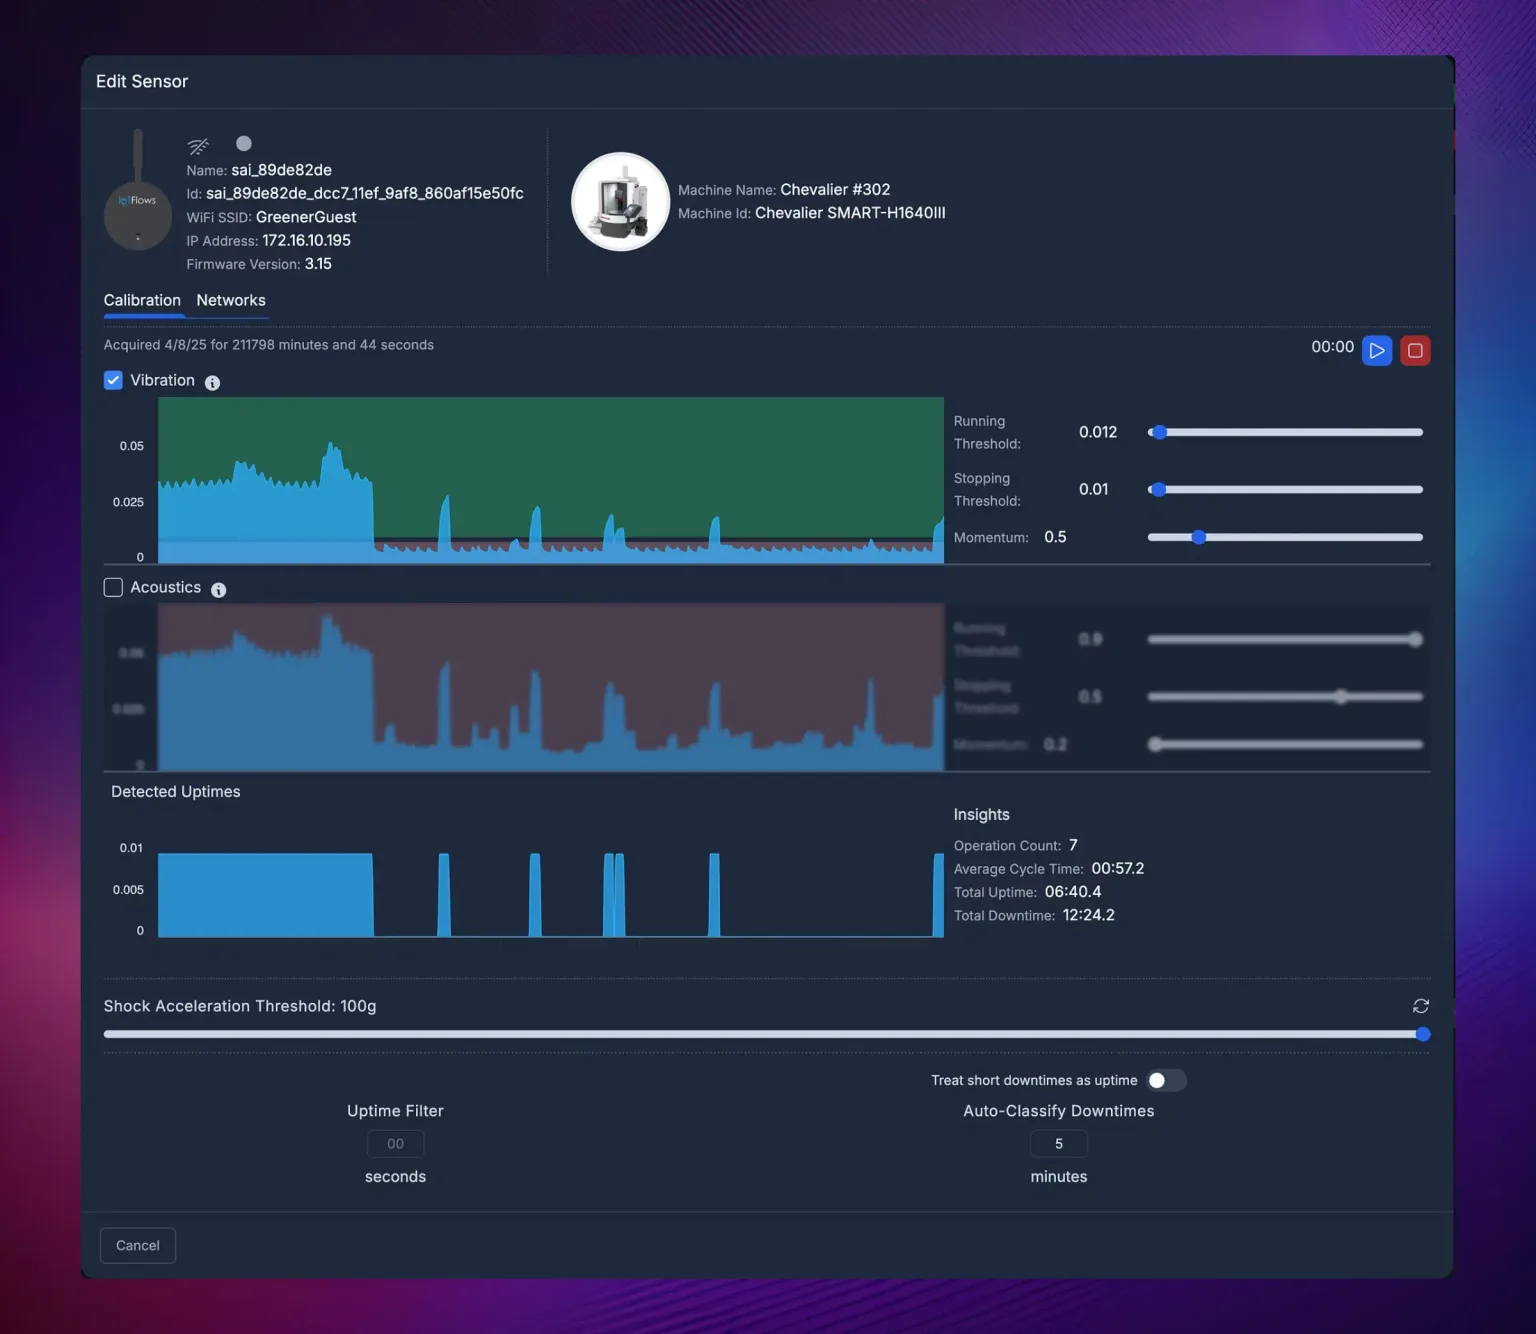 The whole calibration view, which is the same panel on both form factors. Every control on this page lives in it.
Changes made here take effect on the device as you make them. There is no separate save step and no apply button.
Capture a running baseline
- Start the machine and let it reach a normal working cycle.
- Click the blue play button at the top right of the tab.
- Watch the Vibration chart for a full cycle, or two minutes, whichever is longer.
The device streams a reading every few seconds while capture is on, so you are watching the machine now rather than a stored average. A timer beside the play button counts the capture, and the line above it tells you when this device was last calibrated and for how long.
Note two things: the band the trace sits in while the machine works, and its lowest point during the smoothest part of the cut. The second number is the one that matters, because a threshold set above it will drop the machine to stopped every time the cut eases off.
On firmware 3.2 and later a Wi-Fi signal chart captures alongside the vibration chart. Use it while you are here to check the device has usable signal where it is mounted: see Troubleshoot a device that is offline.
Capture a stopped baseline
- Leave capture running.
- Stop the machine, but leave it powered on.
- Watch the trace settle, then click the red stop button.
Capture the machine powered on and not working, not switched off. A powered machine still runs fans, pumps and hydraulics, and that floor is what the stopping threshold has to clear. Calibrating against a dead machine sets the threshold too low, and the machine then reads as running all shift.
Stopping capture fills in the Detected Uptimes chart and the Insights panel beside it: operation count, average cycle time, total uptime and total downtime for the stretch you recorded. That is your scoring tool for the rest of this page. Every time you change a threshold, this chart redraws against the same capture, so you can compare settings without running the machine again.
Set the running and stopping thresholds
Two controls sit beside the Vibration chart, each a slider with a number field.
| Control | What it means | Set it |
|---|---|---|
| Running Threshold | The level the trace must rise above for the machine to read as running. Where uptime starts counting. | Just below the lowest point of the running band you captured. |
| Stopping Threshold | The level the trace must fall below for the machine to read as down. Where uptime stops counting. | Just above the highest point of the idle band you captured. |
Both run from 0.001 to 0.7, and you can drag the slider or type an exact value. Each saves on its own when you release the slider or leave the field, and the dashboard confirms with Vibration Upper Threshold Updated or Vibration Lower Threshold Updated.
The product ships its own explanation of the two, reachable from the ⓘ icon beside the Vibration label:
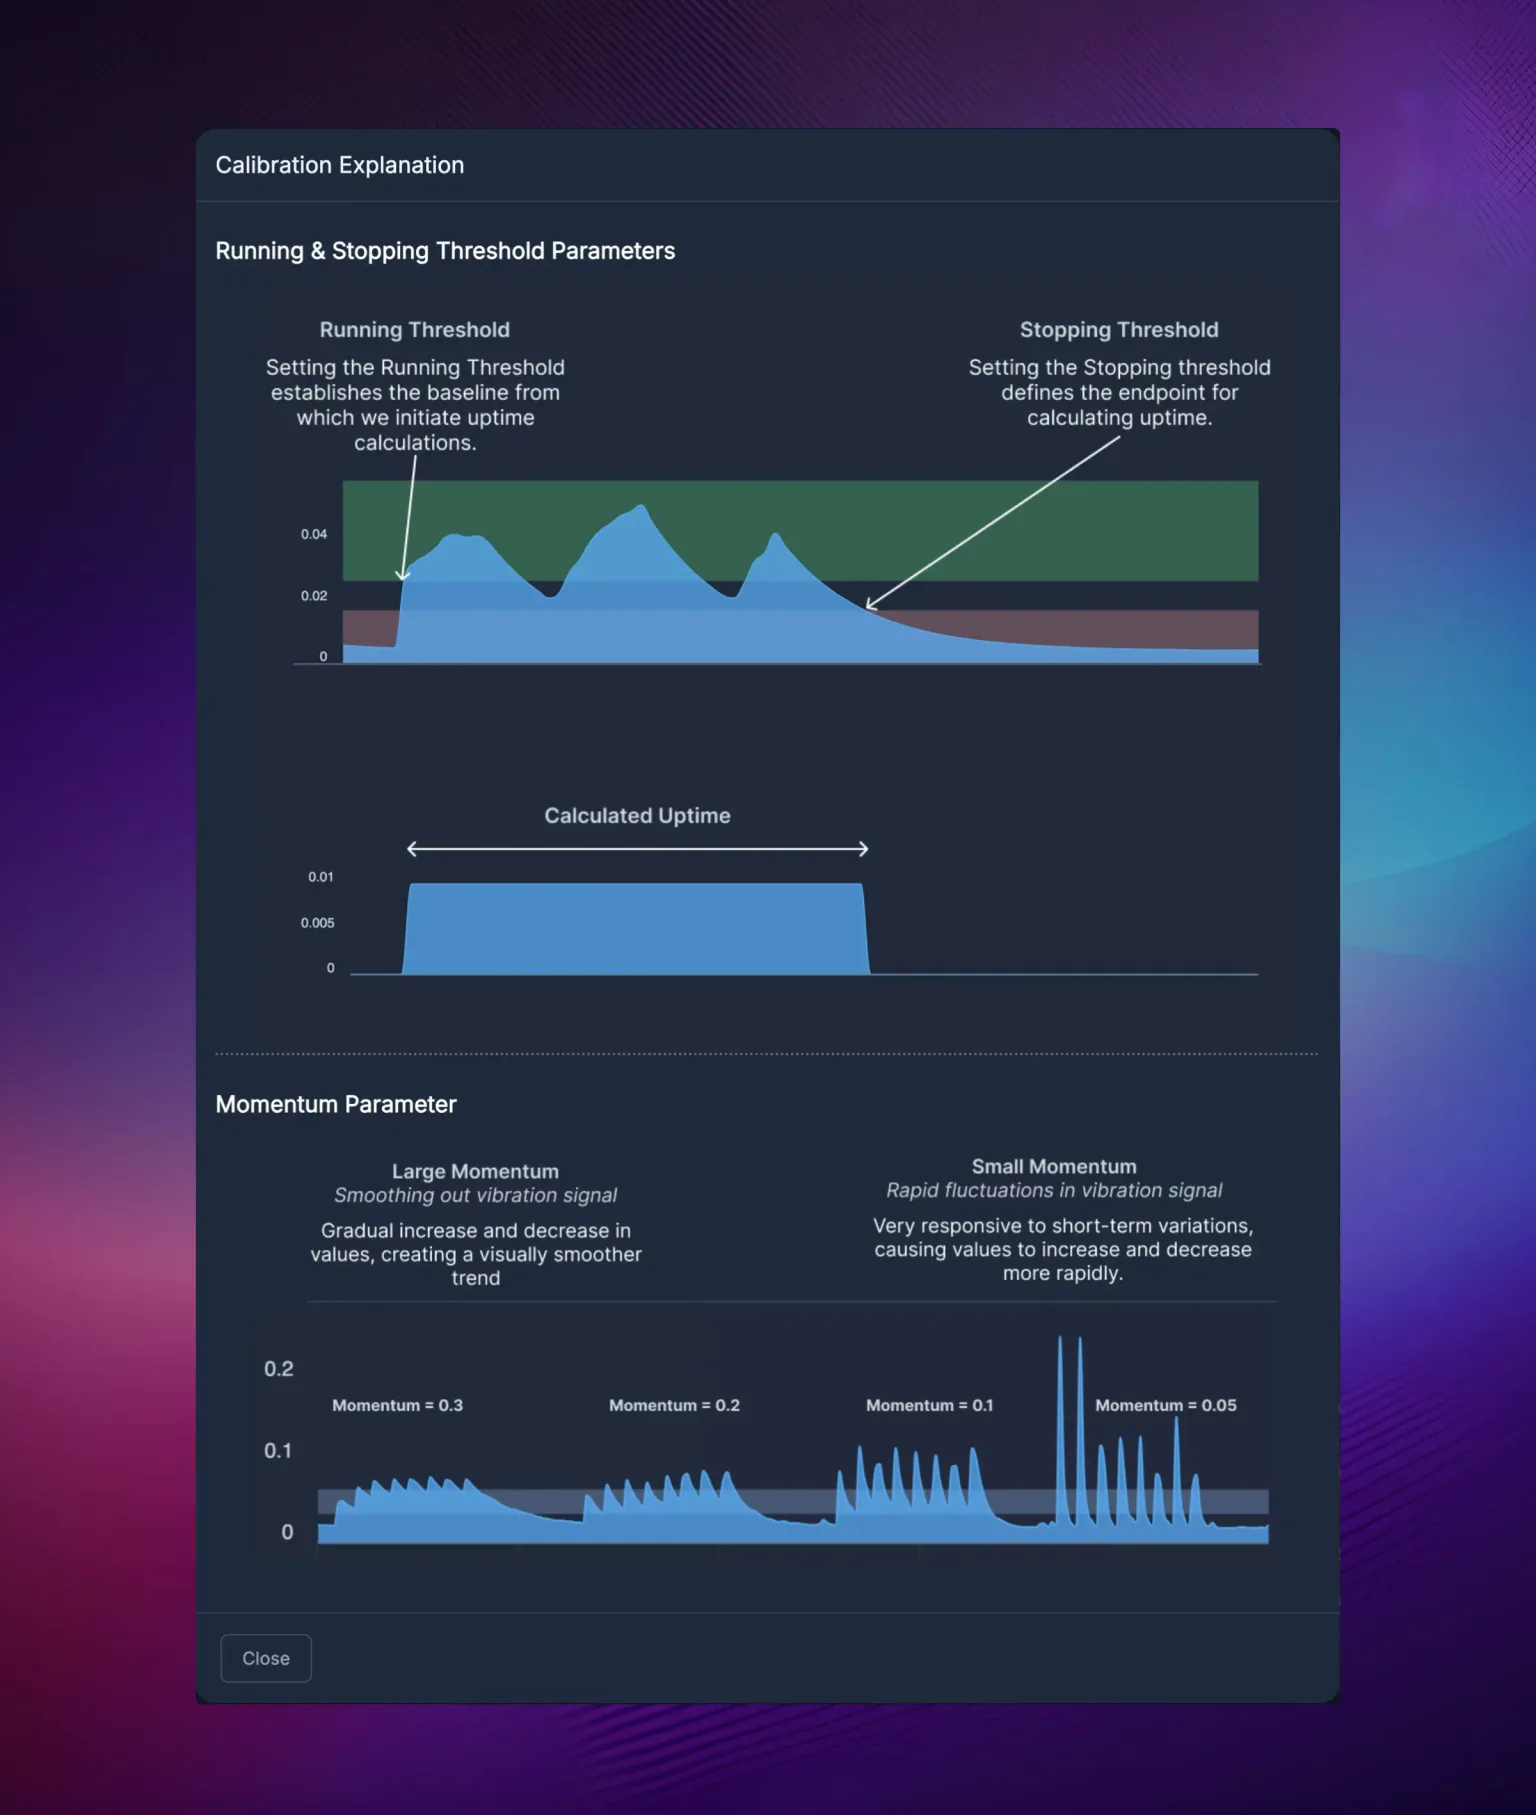 The in-product explanation, reached from the information icon beside the Vibration label. The upper panel shows where each threshold acts on the trace; the lower panel shows the same signal at four momentum values.
Leave a gap between the two. A machine whose vibration wanders across a single line flips state on every wander, and the gap is what absorbs normal variation. Leave a buffer against your observed values too, rather than setting each threshold exactly on the band you measured.
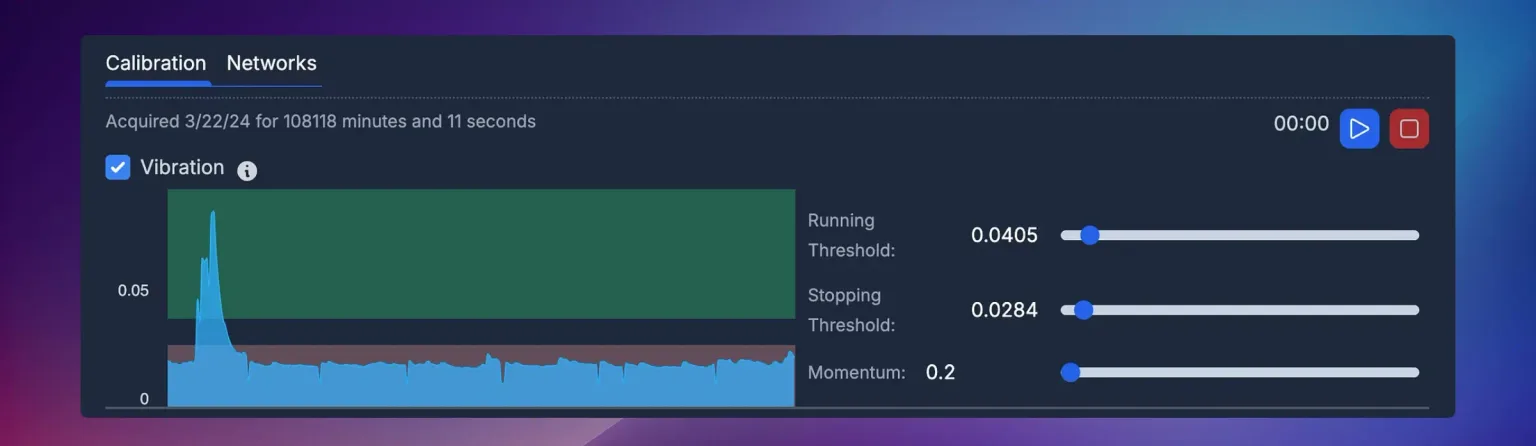 The threshold controls beside the vibration chart. The green band is what counts as running, the red band as stopped.
Set momentum
Momentum is how much the device smooths the trace before comparing it to the thresholds. Higher momentum responds more slowly and ignores brief excursions. Lower momentum responds faster and follows every spike, as the lower panel of the explanation image above shows at four values.
The slider runs from 0.2 to 2 in steps of 0.05, and saves when you release it.
Raise the running threshold when a running machine reads as stopped. Raise momentum instead when the status flickers between running and down on a machine that is genuinely running. The thresholds change what counts as motion; momentum changes how long that motion has to persist before the state moves.
A machine that ramps up and down gradually wants higher momentum. One that cycles in sharp bursts wants lower momentum, or the device smooths the bursts away and misses them entirely.
Momentum is not retroactive. Changing it does not re-score data you have already captured. Capture again after every momentum change, or you are reading the old value's results.
Momentum is stored per channel. If you run vibration and acoustics together, each carries its own momentum and its own pair of thresholds.
Set the shock threshold
A shock is a single sharp acceleration, the signature of a crash or a collision rather than of work. Shock Acceleration Threshold is the level in g above which the device reports one. The slider runs from 20 g to 100 g in steps of 1, starts at 100 g, and saves when you release it.
Set it above anything the machine does normally and below anything you want to hear about. A press that hits 35 g every stroke needs a threshold well clear of 35 g, or every stroke reads as a crash. Watch the normal range during calibration first, then place the threshold against what you saw.
You do not need this if nobody acts on shock events. It has no effect on running or stopped detection, so leaving it at its shipped value costs you nothing in uptime accuracy.
 The Shock Acceleration Threshold slider, here at the top of its range.
Choose which channels the device analyses
Two checkboxes above the charts decide which channels the device analyses: Vibration and Acoustics. At least one stays selected, and the dashboard will not let you clear both.
Default to Vibration alone. Acoustics picks up the room as well as the machine, so on a floor with neighbouring equipment it adds noise rather than signal. Turn it on when the work is audible but barely moves the housing.
Each channel carries its own running threshold, stopping threshold and momentum, so turning acoustics on means calibrating a second set of three controls rather than reusing the vibration numbers.
Filter out short uptimes
The uptime filter drops any run shorter than a set number of seconds, so a bump against the machine or a neighbor's vibration does not register as production.
Enter a value in seconds under Uptime Filter and click away from the field. It applies to data older than about 30 minutes, so recent history is left alone.
 The Uptime Filter field. Any run shorter than this many seconds is removed from uptime.
The effect on the record looks like this:
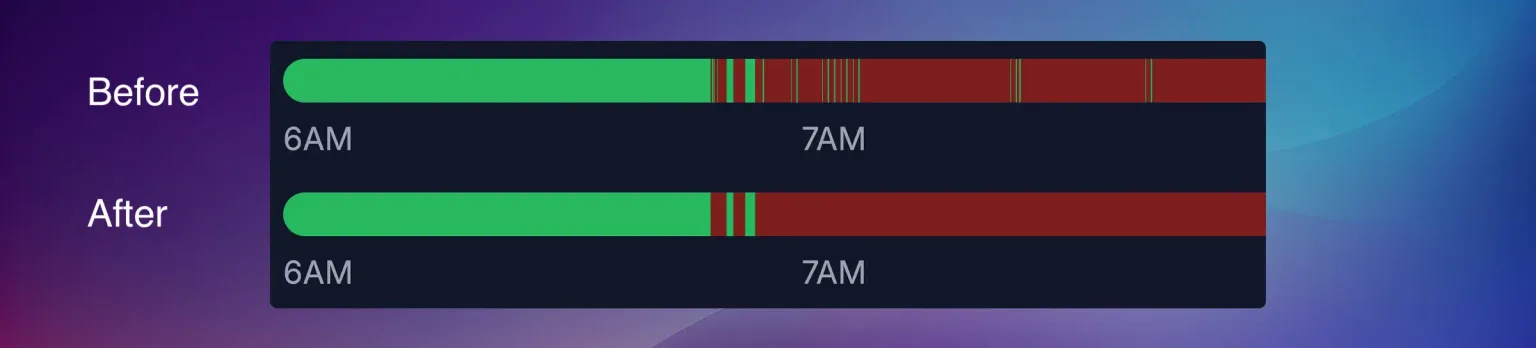 Before and after the uptime filter. Short green slivers inside a long stop are absorbed into the downtime around them.
Set this last. Applied before the thresholds and momentum are right, the uptime filter hides the symptom you were about to use to correct them. A machine that keeps producing one-second runs is telling you the thresholds are wrong, not that it needs a filter.
Most machines settle between 5 and 15 seconds. Very stable environments can go lower, to 3 to 5 seconds. Floors with a lot of neighbouring vibration may need 15 to 30 seconds.
Handle short stops
Short pauses are part of how most machines run. Tool changes, part loading and indexing all stop the spindle without being downtime anybody wants to chase.
The Treat short downtimes as uptime toggle picks how they are handled, and the field below it sets the cutoff in minutes. The field's label changes with the toggle, so the label tells you which behavior is active:
| Toggle | Field label | What happens to a stop under the cutoff |
|---|---|---|
| Off | Auto-Classify Downtimes | It stays downtime and is given the Short Downtime reason code automatically. |
| On | Downtime Threshold | It is converted to runtime and stops counting as downtime at all. |
 The short-stop control with the toggle on. The field label reads Downtime Threshold, so stops under two minutes become runtime.
Leave the toggle off when you want the pauses visible and sorted. Classified stops still appear as downtime, in a darker red than unclassified ones, so the shift record keeps them while the reason code explains them.
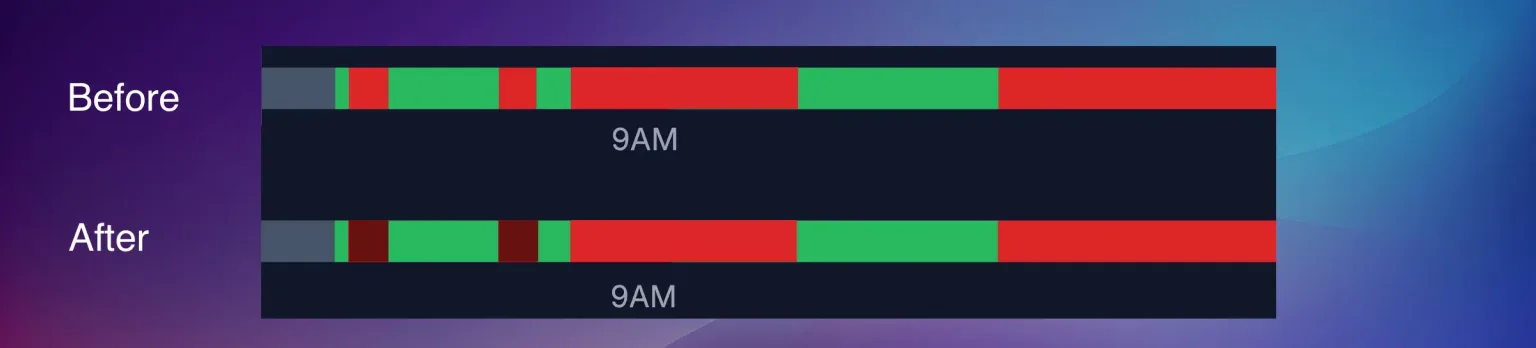 Auto-classify, with the toggle off. Short stops stay downtime and turn darker red, marking them as classified.
Turn the toggle on when short pauses are part of the cycle and counting them distorts the numbers. Indexing time and brief cooldowns are the usual cases.
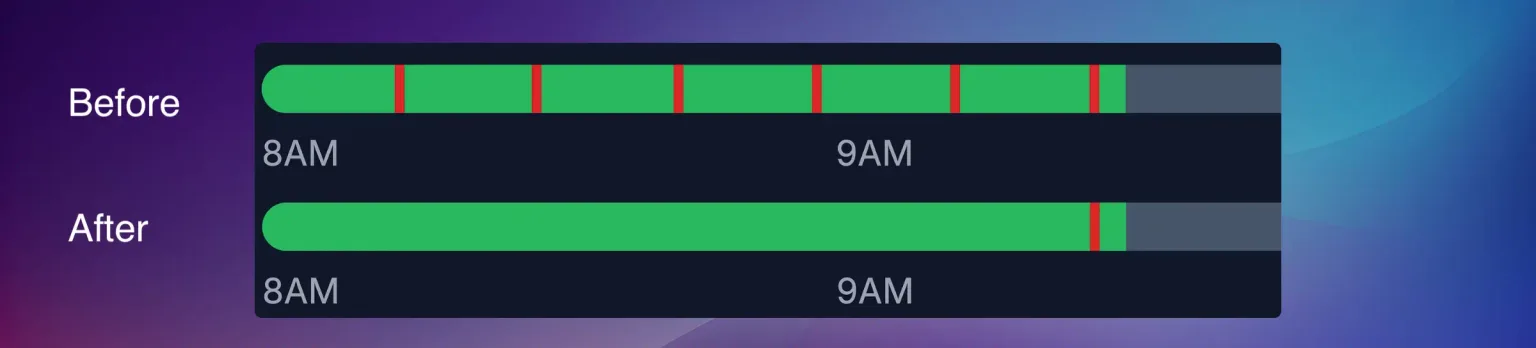 Convert to uptime, with the toggle on. Short stops disappear into the runs around them.
Both behaviors look back at stops older than about 30 minutes rather than reclassifying live, so neither changes what the floor sees right now.
The Short Downtime reason code itself is edited in Organization Settings under Short Downtimes, and the colors these bars use are set from Assets Overview under Adjust Status Colors. See Status colors.
Verify the calibration
Calibration is settled by comparison, not by inspection.
- Test both states. Run the machine for a few minutes, then stop it and leave it idle. Check the dashboard reflects both.
- Review the last hour. Compare the recorded uptime and downtime against what the machine actually did.
- Watch 24 to 48 hours. Look for a pattern of mis-detection rather than a single wrong reading, then adjust once.
Make one change at a time and re-check before the next. Two changes at once leave you unable to say which one helped.
Gray on the status bar is not downtime. It marks a stretch the device was not reporting at all, which is a connectivity problem rather than a calibration one. A bar striped with gray through a shift points at the network, not the thresholds. See Troubleshoot a device that is offline.
Common mistakes
| Mistake | What it causes |
|---|---|
| Thresholds set too close together | Rapid flickering between running and down |
| Momentum set too low | Every minor vibration moves the state |
| Uptime filter set before the thresholds | Masks a calibration problem instead of fixing it |
| Only one state captured | Thresholds placed against a guess rather than a measurement |
| Idle captured with the machine switched off | Stopping threshold set below the machine's real floor, so it reads as running all shift |
Troubleshoot calibration
The live charts stay empty after you press play. The device is not reporting. Confirm it is online and paired to this asset, then see Troubleshoot a device that is offline.
The machine reads as running when it is idle, or idle when it is running. The thresholds are in the wrong place for this machine. Capture both states again and reset them against what you see. Check you captured true idle, powered on and not working, rather than the machine switched off.
Everything still reads as running after you raise the stopping threshold. The mount is passing the device a neighbouring machine's vibration rather than this machine's. The surface has to be mechanically tied to the parts that move, see Install and power up SenseAi.
The status flickers between running and down. Raise momentum, then widen the gap between the two thresholds. If it persists, something near the machine is vibrating it. The uptime filter is the last resort here, not the first.
A change does not seem to take effect. Confirm the device is online, wait 30 to 60 seconds, then reload the page. If a setting snaps back to its old value with a red message, the save failed and nothing changed on the device.
What differs on SenseAi Embedded
The procedure above is the whole procedure for SenseAi Embedded. Every control and every step is the same.
One difference: SenseAi Embedded reads vibration only, because its IP67 enclosure is sealed. The acoustics channel does not apply, so Choose which channels the device analyses is a section you can skip, and the second set of thresholds and momentum never comes into play.
Calibrate from the mobile app
The IoTFlows mobile app exposes sensitivity and momentum only. Sensitivity is a single combined control over what counts as motion, in place of the two thresholds the dashboard gives you.
Use the app at the machine for one quick adjustment. Use the dashboard for a first calibration: the app has no live trace and no Detected Uptimes chart, so you cannot see what you are setting the thresholds against. See Install the mobile app.
Sensitivity also appears on the web for devices running firmware below 2.0, alongside momentum and the shock threshold, each with its own submit button.
Where each setting is stored
Two of these controls belong to the machine, not the sensor. Swapping the sensor on a machine carries those two across; the rest are device settings and go with the device.
| Control | Stored as | Belongs to |
|---|---|---|
| Running Threshold | node_vibration_upper_threshold, node_acoustic_upper_threshold | The sensor |
| Stopping Threshold | node_vibration_lower_threshold, node_acoustic_lower_threshold | The sensor |
| Momentum | node_vibration_momentum, node_acoustic_momentum | The sensor |
| Shock Acceleration Threshold | node_shock_threshold | The sensor |
| Channel checkboxes | node_analysis_mode | The sensor |
| Sensitivity (firmware below 2.0, and mobile) | node_sensitivity | The sensor |
| Uptime Filter | asset_uptime_filter_seconds | The machine |
| Auto-Classify Downtimes / Downtime Threshold | asset_auto_classify_downtimes_less_than_min | The machine |
| Treat short downtimes as uptime | asset_filter_downtime_instead_of_classification | The machine |
Field-by-field detail, including ranges and defaults, is on Calibration settings.
See also
Move a deployed SenseAi, SenseAi Embedded or BeamTracker onto a different network from the dashboard's Networks tab, without a phone or a trip to the machine: push a new SSID and password over the device's existing connection, reuse a network your organization has already saved, or delete saved credentials that have gone stale. The device must be online; an offline device still needs Bluetooth provisioning from the mobile app.
Calibrate a BeamTracker in two halves: the beam values decide what the laser counts as a part, and the downtime filter decides how long a gap between parts may run before the line reads as stopped. Both live in the device's Calibration tab on the dashboard, alongside a live beam view that plots the raw reading against the thresholds you are setting.